Here’s the thing about weather apps: they tell you what the weather is, but not what to do about it. If you’re a lawn care pro, you don’t need to know it’s 62°F with 40% humidity. You need to know: Can I mow this lawn right now without getting my equipment stuck?
That question led us down a rabbit hole that ended with building something we never expected: a physical weather display that sits on your desk and actually makes decisions for you.
The Problem Nobody Was Solving
We partnered with Turf N Surf Lawn and Pool LLC to build MOWCAST. They had a real problem: checking weather for 20+ properties every morning meant opening weather apps, typing addresses, scrolling through forecasts, and mentally calculating “okay, it rained yesterday… ground’s probably wet… better skip this one.”
That’s exhausting. And it’s the same problem construction crews face. And roofers. And pool service techs. And anyone else who works at multiple outdoor locations.
Designing for Glance-ability
The core design challenge: How do you show weather for 20 locations in a way someone can understand in 3 seconds?
The 6-Screen Cycle
We landed on a rotating display that cycles through 6 screens every 10 seconds. Each screen has one job:
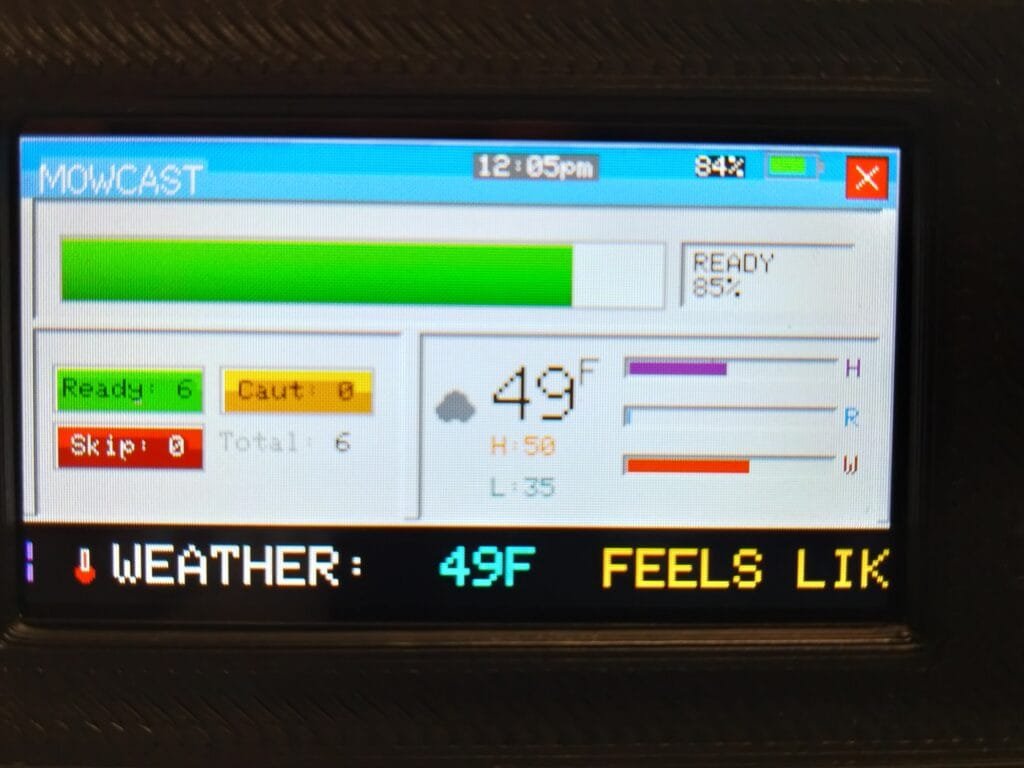
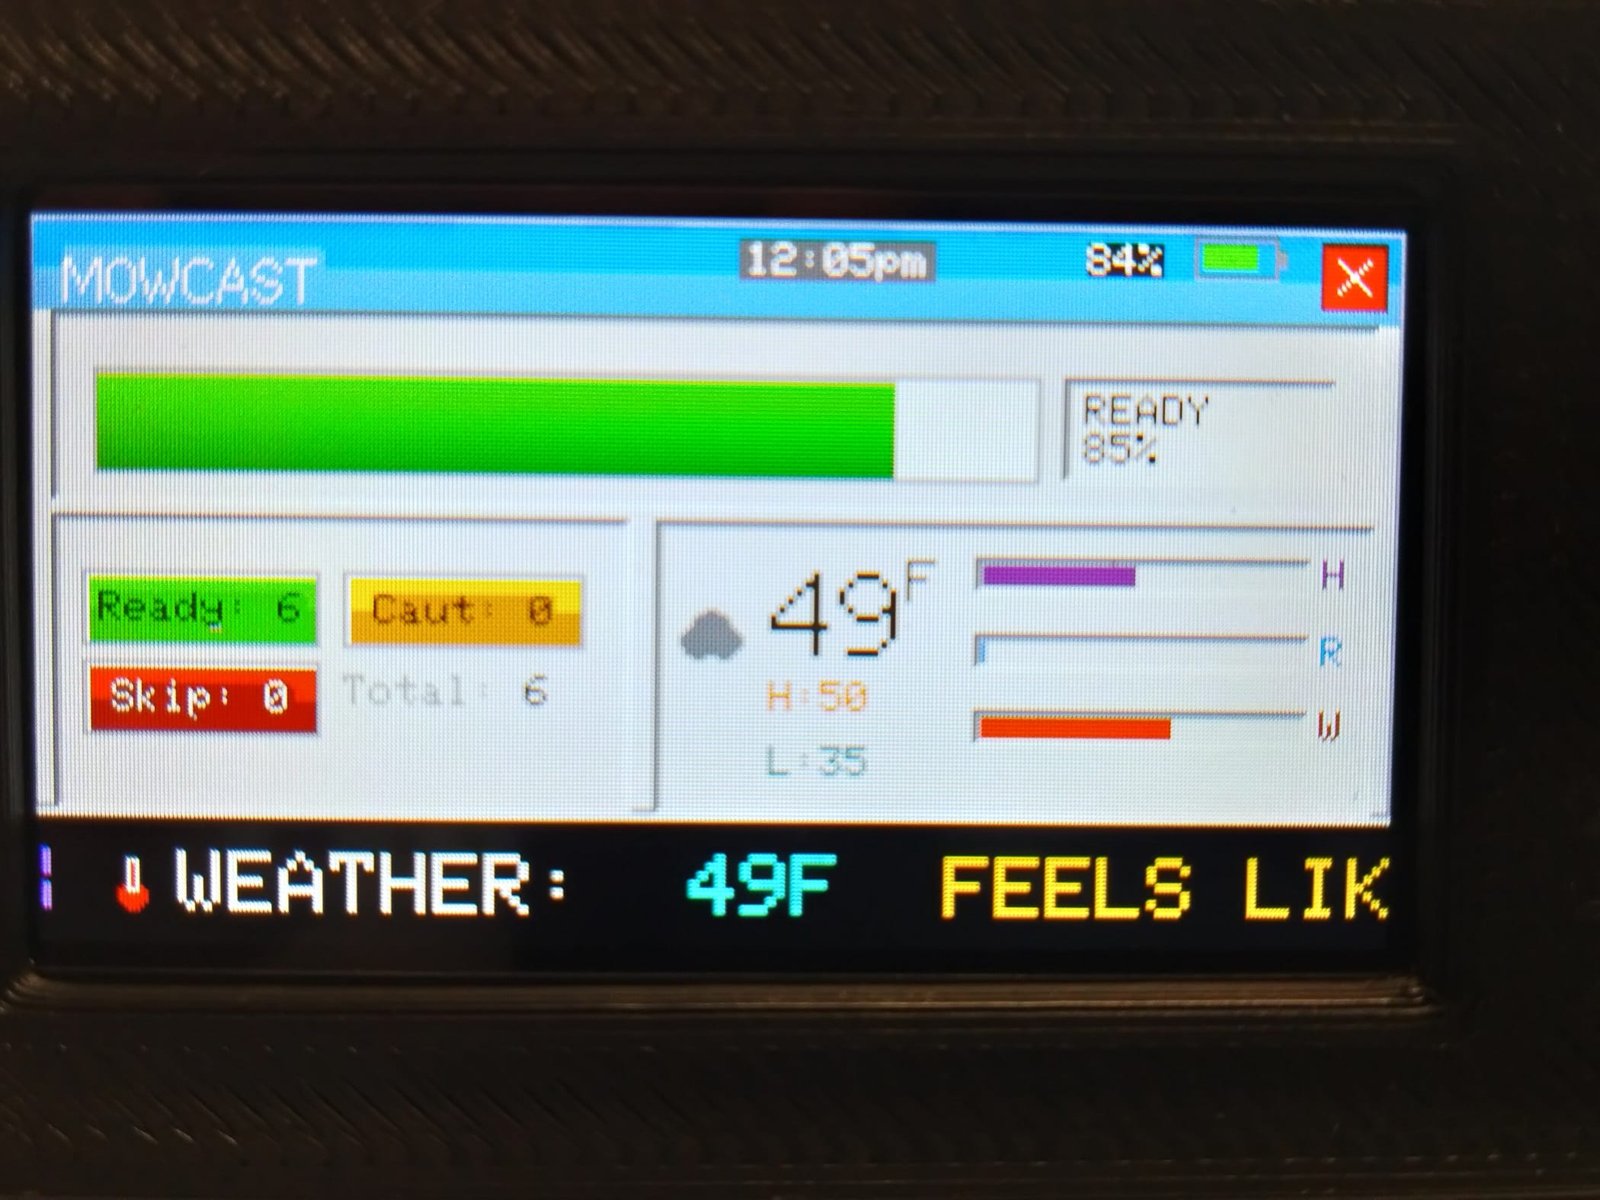
Screen 1: Dashboard Summary
Property counts, MowScore bar, current conditions with visual bars. Know your day instantly.
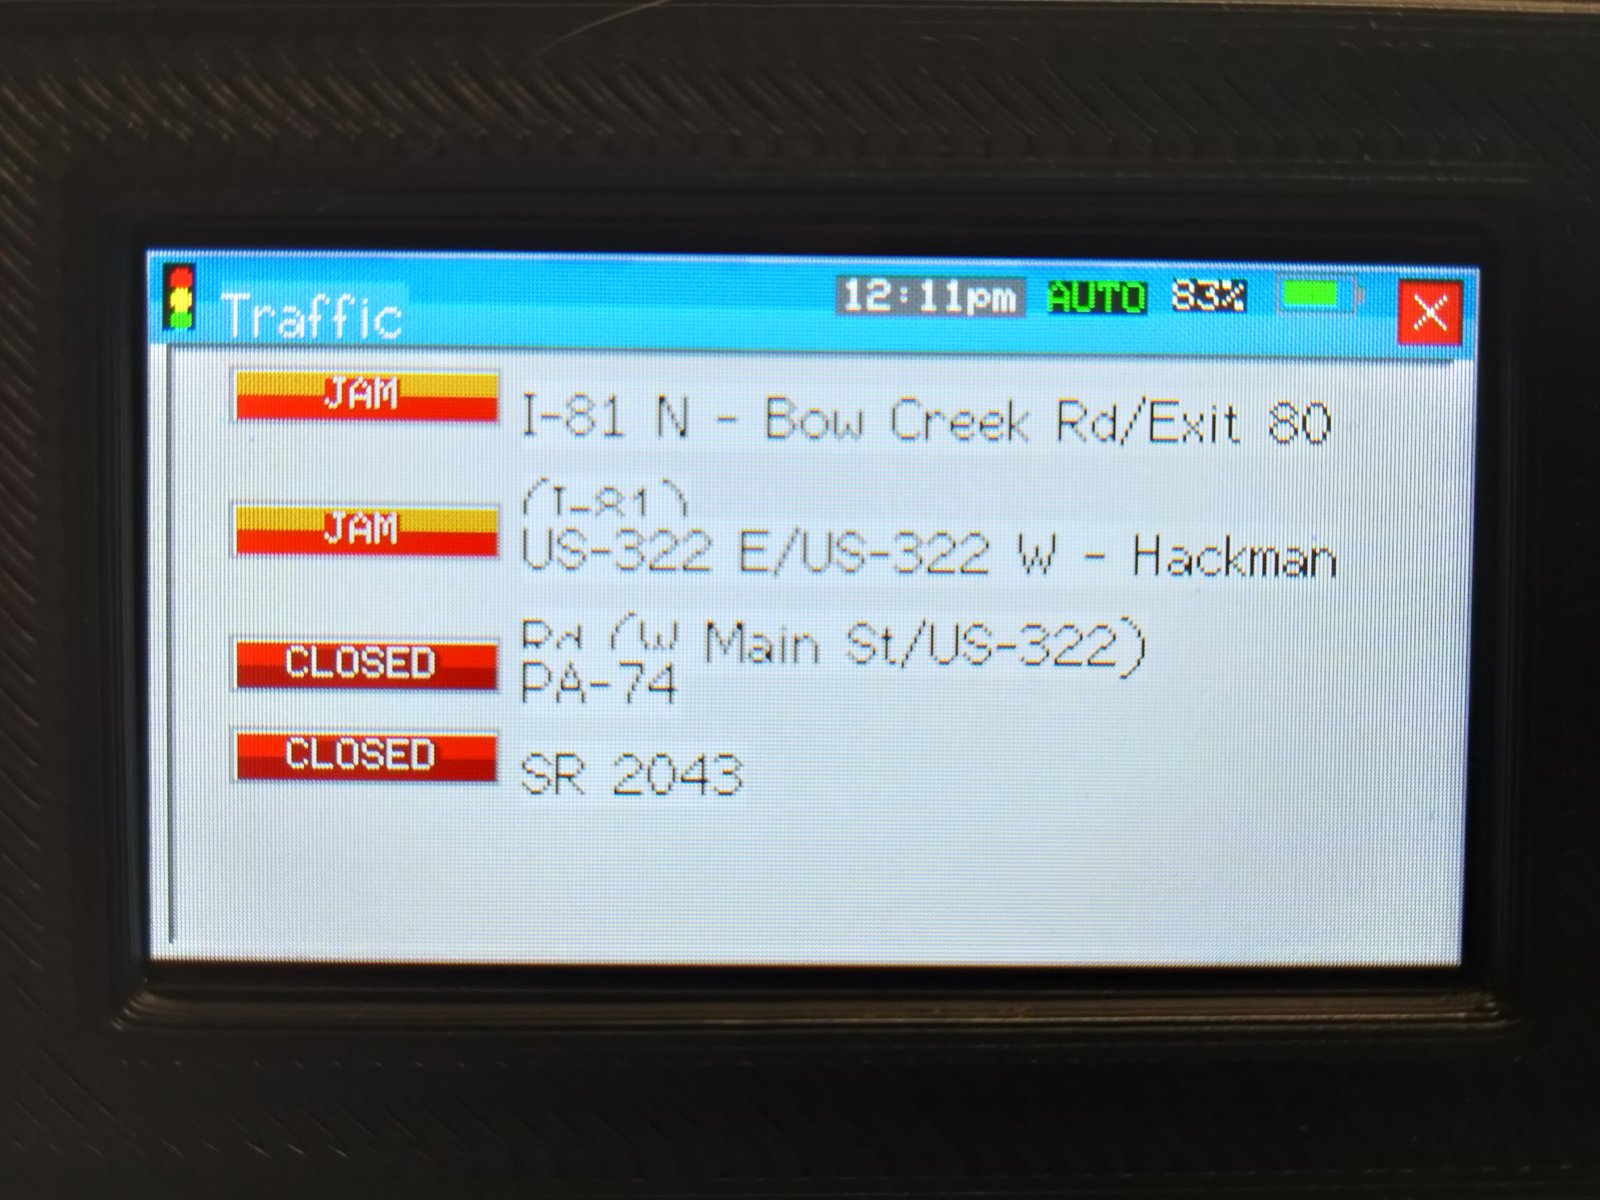
Screen 2: Live Traffic
Real-time incidents within 30 miles. Colored badges (JAM, CLOSED) with road names.
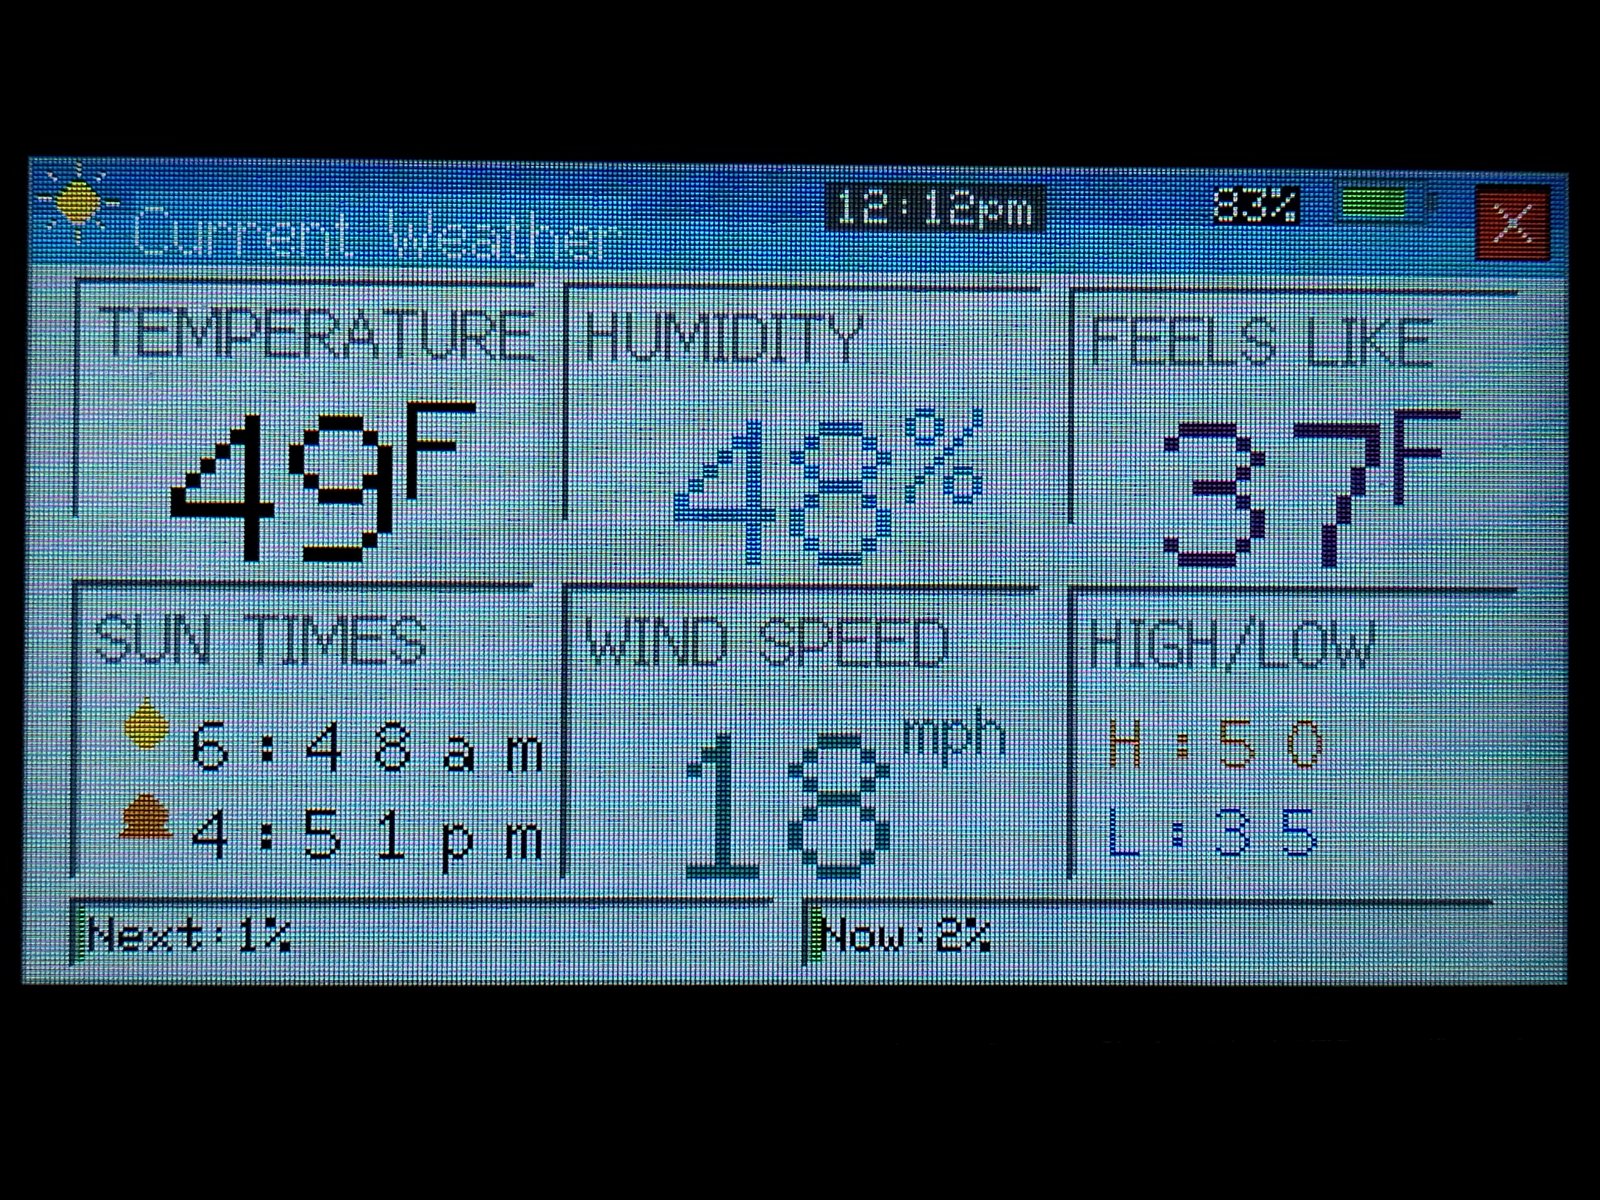
Screen 3: Current Weather
Temperature, feels-like, humidity, wind, sunrise/sunset. All the numbers that matter.
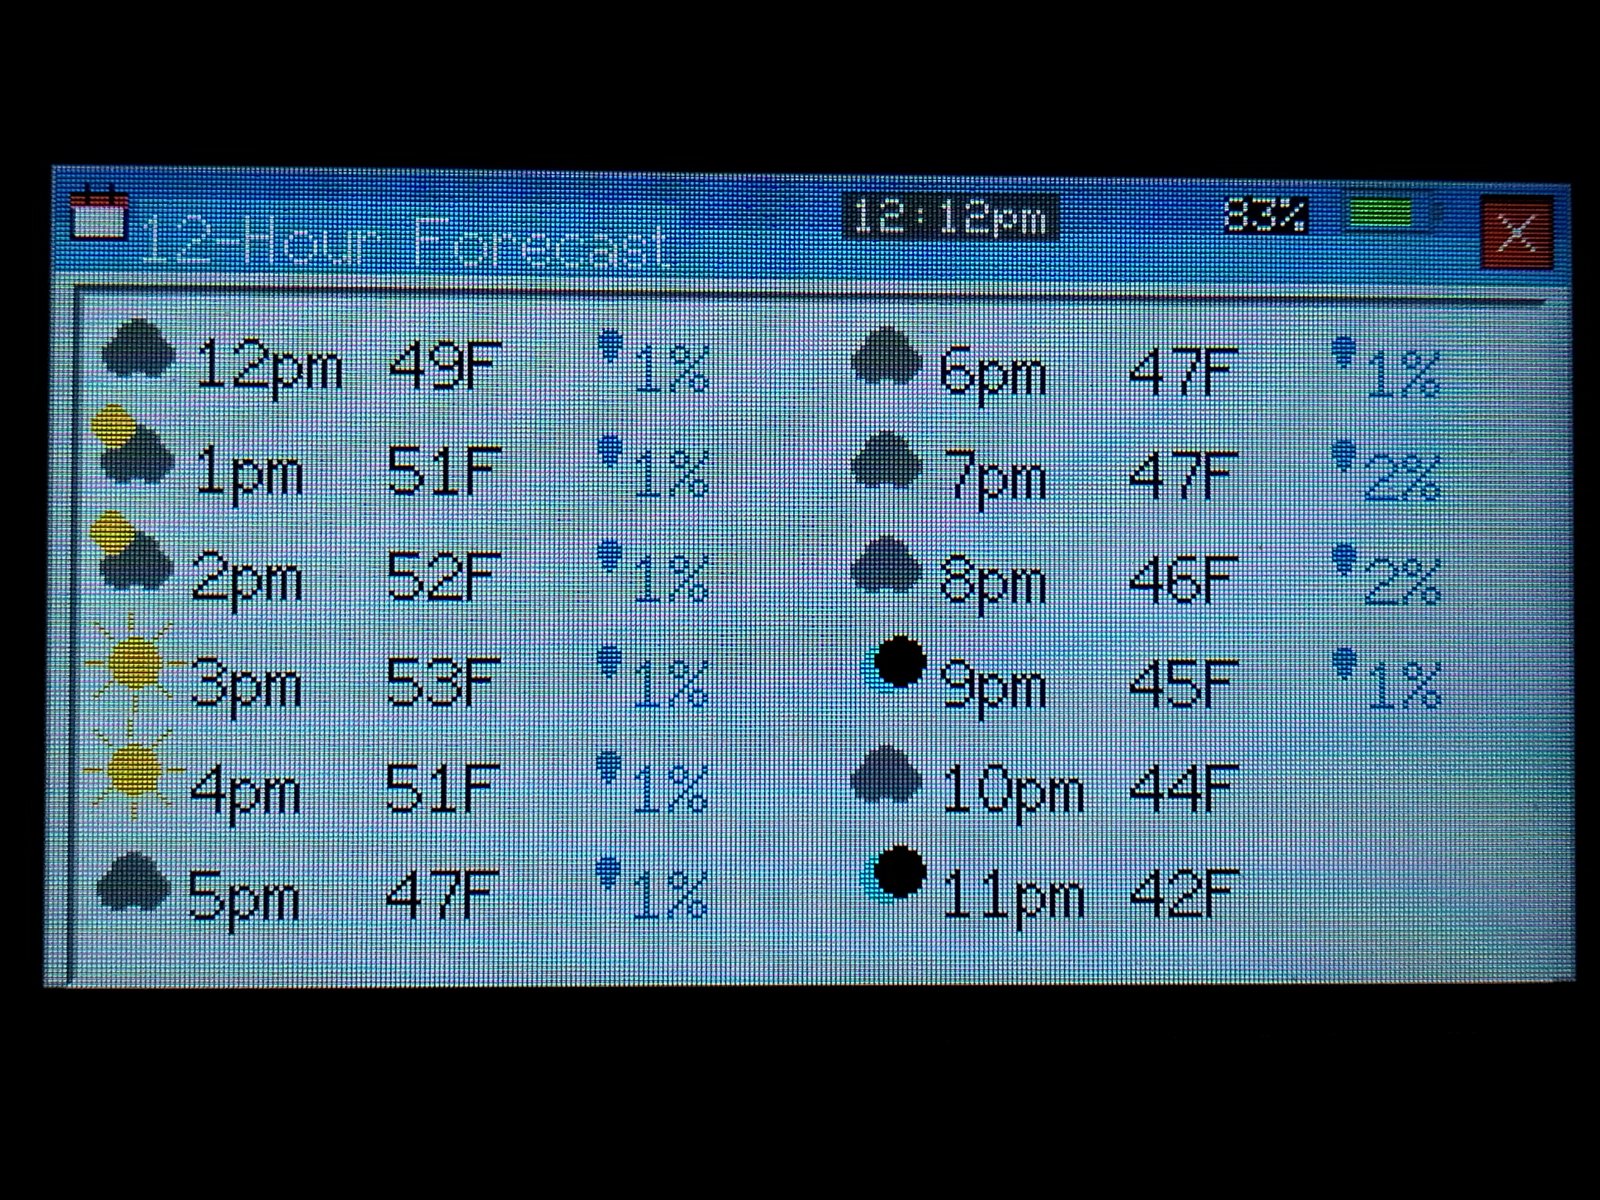
Screen 4: 12-Hour Forecast
Hour-by-hour temperature and rain. See exactly when conditions change.
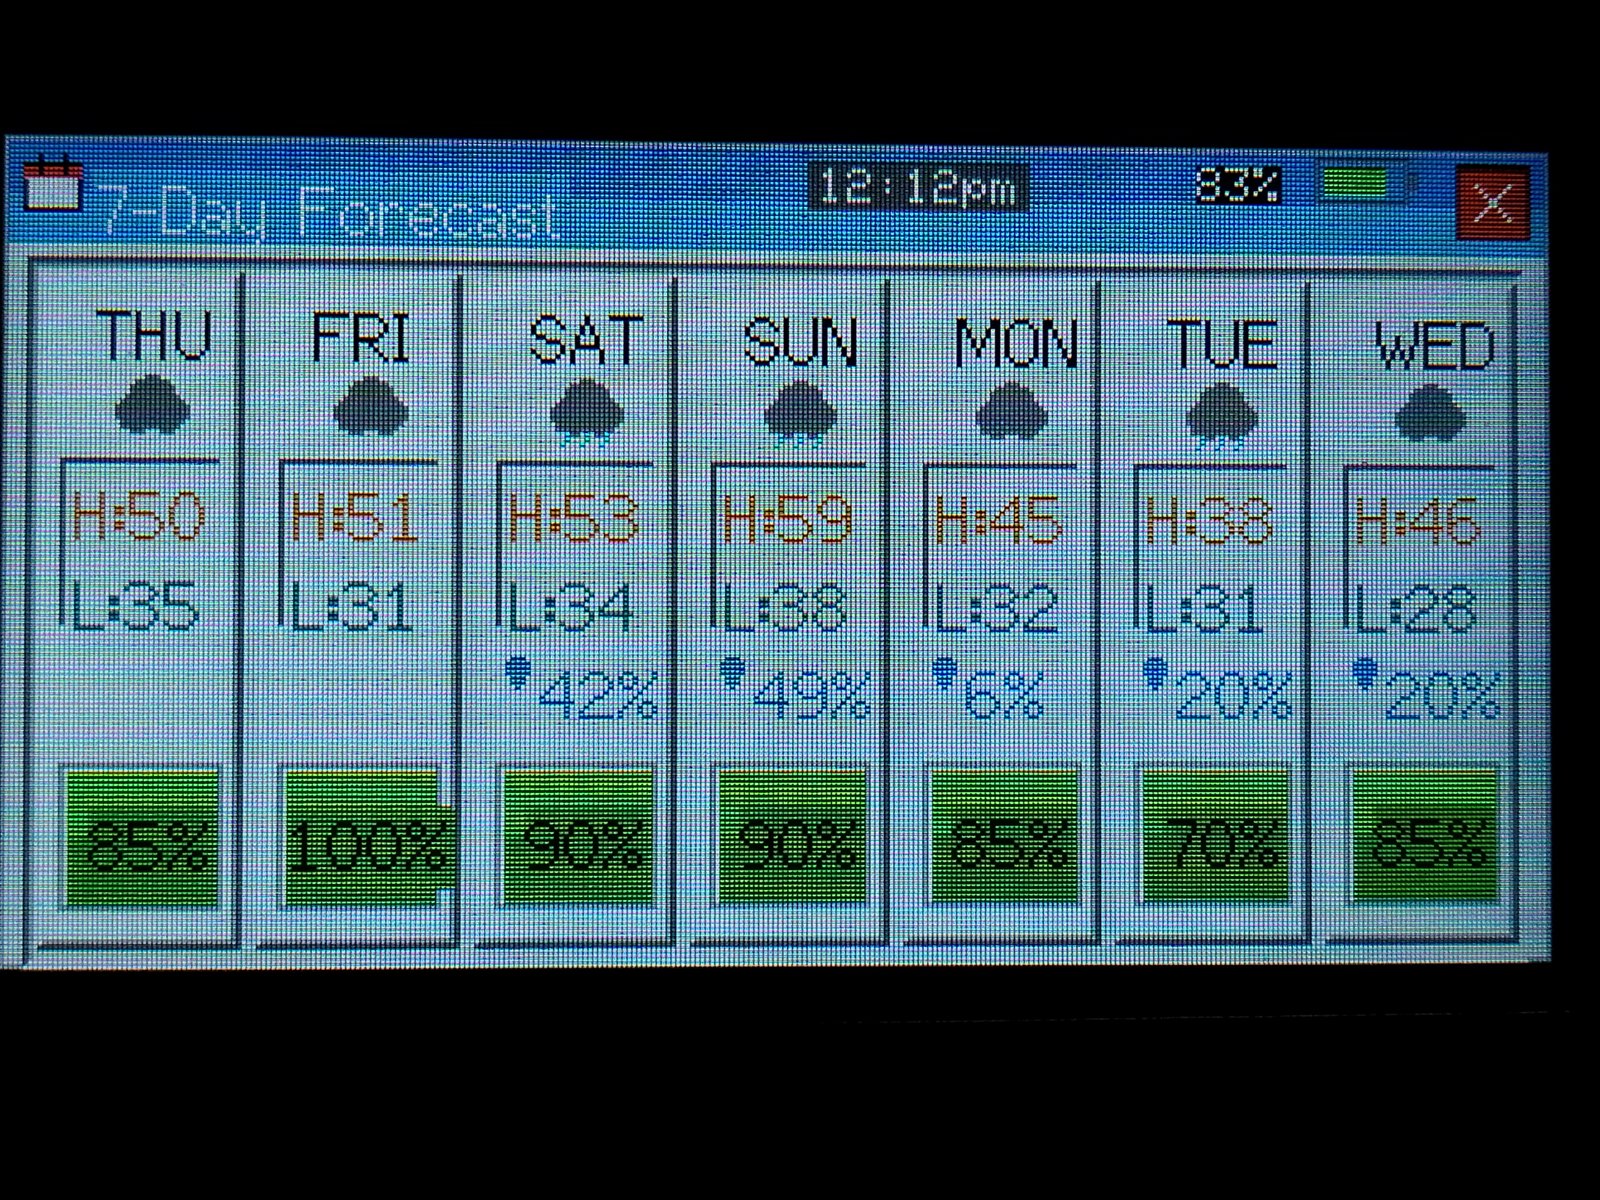
Screen 5: 7-Day Forecast
Week at a glance with MowScore bars. Plan your schedule, see best work days.
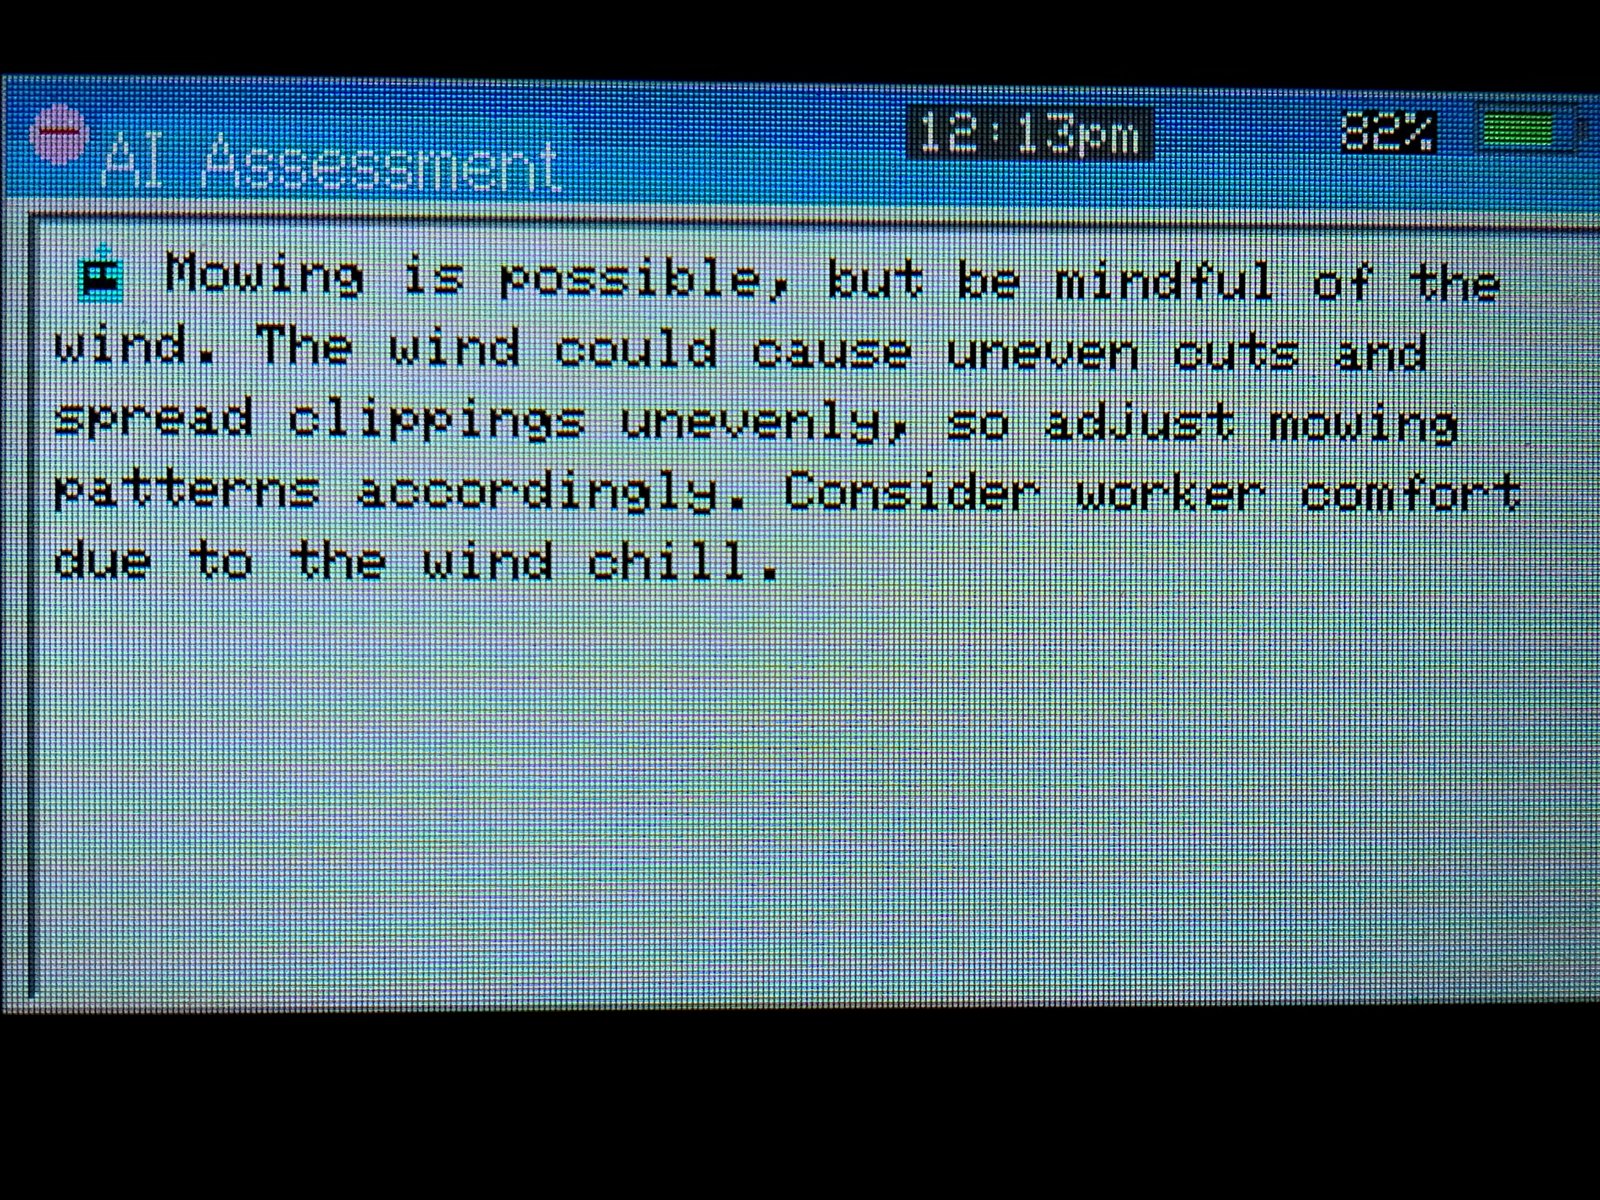
Screen 6: AI Assessment
Google Gemini gives contextual advice. Not just data – actual guidance.
Design Decisions That Mattered
Color = Instant Understanding
Green means go. Yellow means caution. Red means stop. We didn’t reinvent the wheel – we used colors everyone already understands from traffic lights. Properties get sorted automatically into these categories based on our MowScore algorithm.
No Scrolling, Ever
The display is 3.5 inches. You can’t scroll. So every screen has to fit everything that matters. This constraint forced us to be ruthless about information hierarchy. What’s the ONE thing you need from this screen?
Auto-Rotation with Manual Override
Screens rotate automatically every 10 seconds, but buttons let you jump to any screen instantly. Set it and forget it, or take control when you need it.
The MowScore Bar
Instead of making users interpret “62°F, 40% humidity, 8mph wind, 10% rain” – we built an algorithm that turns that into a single number: 85% ready to work. A big green progress bar shows it visually. Instant decision.
What We Actually Built
📱 MOWCAST Smart Weather Display
- Hardware: LilyGO T-Display-S3 (ESP32-S3)
- Display: 3.5″ LCD (320×170 resolution)
- Connectivity: WiFi 802.11 b/g/n
- Power: USB-C (5V)
- APIs: Open-Meteo, NOAA/Weather.gov, TomTom Traffic, Google Gemini AI
- Traffic Range: 30-mile radius from home base
- Update Frequency: Every 60 minutes (configurable)
- Assembled: Pennsylvania by LXB Studio LLC
Each device is hand-assembled, programmed with custom firmware, and tested before shipping. The enclosure is 3D printed in-house. The software updates itself over WiFi.
Beyond Lawn Care
Here’s what surprised us: once we built it for lawn care, we realized it works for anyone who works at multiple locations.
🏗️ Construction
Track all job sites, plan your day before leaving the shop
🏠 Roofing
Monitor wind speeds, schedule jobs during perfect conditions
🏊 Pool Service
Weather + traffic for every stop on your route
💼 Sales Reps
See conditions at each client location before appointments
🚗 Commuters
Track weather at home, work, kids’ activities
👨🌾 Farmers
Monitor conditions across multiple fields
The Web Dashboard
The device is cool, but it’s powered by a full web dashboard that lets you manage everything. Same design language: clean, colorful, instant understanding.
Users add up to 20 properties. Each property gets analyzed hourly. The dashboard groups them by status (Ready, Caution, Skip). Click any property to see detailed forecasts, AI analysis, and predictive scheduling.
The dashboard works on phones too, so you’re not tied to your desk. Check conditions from your truck, at a job site, wherever.
Email Alerts That Don’t Suck
Most weather alerts are noise. “Rain today!” Yeah, we can see that. MOWCAST sends two types of emails:
Perfect Condition Alerts: “4 properties are ready to mow right now – perfect window before rain at 2pm”
Rain Warnings: “Heavy rain expected tomorrow. Properties to skip: [list]”
Actionable. Specific. Useful.
What We Learned
1. Constraints Breed Creativity
The tiny 3.5″ screen forced us to prioritize ruthlessly. Every pixel had to earn its place. That discipline made the design better.
2. Color > Words
People process color faster than text. A green bar communicates “ready to work” faster than the words “Conditions are favorable for outdoor work activities.”
3. Real Users = Real Insights
We thought rain timing wasn’t that important. Lawn care pros told us it’s HUGE. Knowing rain comes at 2pm vs. all day changes everything. So we added “Best Mowing Window: Morning (rain after 2pm)” to the display.
4. Design for Scanning, Not Reading
Nobody reads weather displays word by word. They scan for patterns. Big numbers. Color changes. Icons. We designed for that behavior.
The Founder’s Package
We’re launching with a special offer: $499 gets you 18 months of Pro Dashboard access (20 properties, unlimited everything) plus a free MOWCAST Smart Display device.
After the first 50 customers, the device costs $150 and the dashboard goes to $50/month. We’re keeping the founder’s pricing low because we want real users testing this thing in the field.
See It In Action
Watch the device cycle through all 6 screens and see how it actually works in real life.
Check Out MOWCAST →Why We Built This
LXB Studio builds tools for people who work outside. Not office workers checking email. Not software developers pushing code. People who dig ditches, mow lawns, fix roofs, pour concrete.
Those folks don’t have time for complicated apps. They need information fast, decisions clear, and tools that just work.
MOWCAST is our answer to that challenge. It’s not the fanciest weather display. It’s not the most feature-packed. But it does one thing really well: tells you where to work today.
And sometimes that’s all you need.
Built by LXB Studio LLC in partnership with Turf N Surf Lawn and Pool LLC
Pennsylvania-made. Real-world tested. Ready to ship.
Want to Build Something Like This?
LXB Studio specializes in designing tools for outdoor professionals and blue-collar businesses. We turn complicated problems into simple, usable products.
VERY cool. Great job 🌟
This is the future of outdoor work – less scrolling, more mowing!
you have any better pics or videos of this ??? Need to see it